DS.js
DS.js is a bookmarklet that converts any webpage with tabular datasets into an environment to learn basic Data Science programming. More details can be found in our UIST2017 research paper DS.js: Turn Any Webpage into an Example-Centric Live Programming Environment for Learning Data Science.
Installation
Simply drag this link to your bookmark bar and you are all set.
DS.js Workflow
Here we show a typical workflow of using DS.js to put lightweight environments under tabular datasets and program inside it.
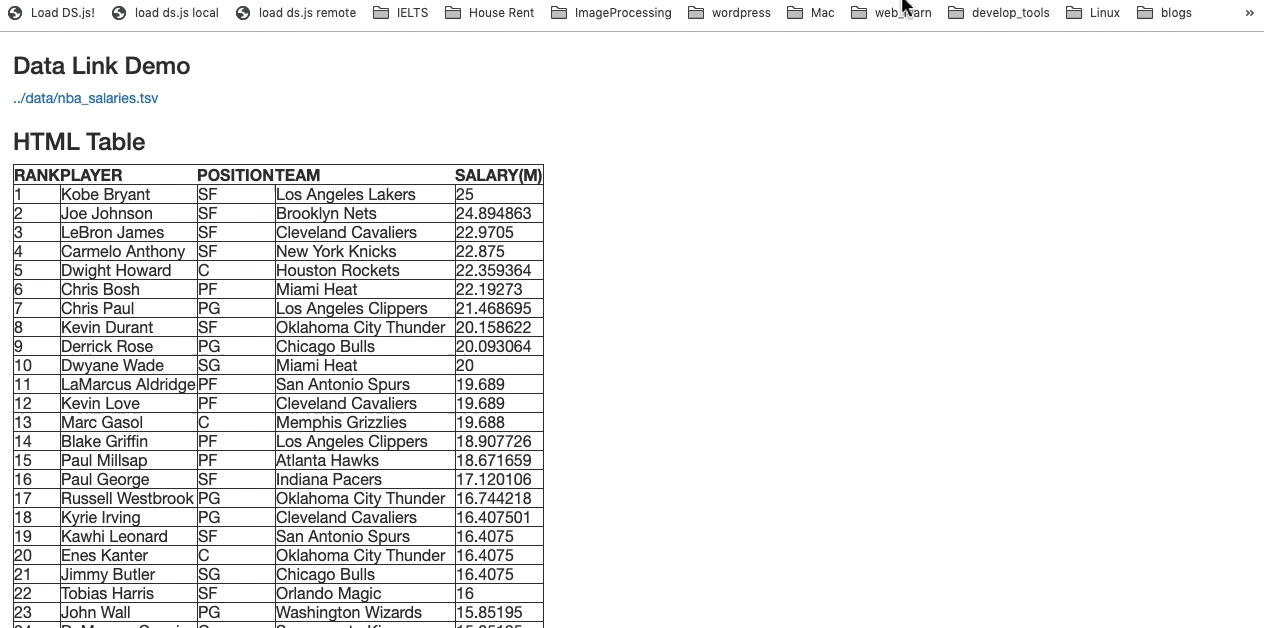
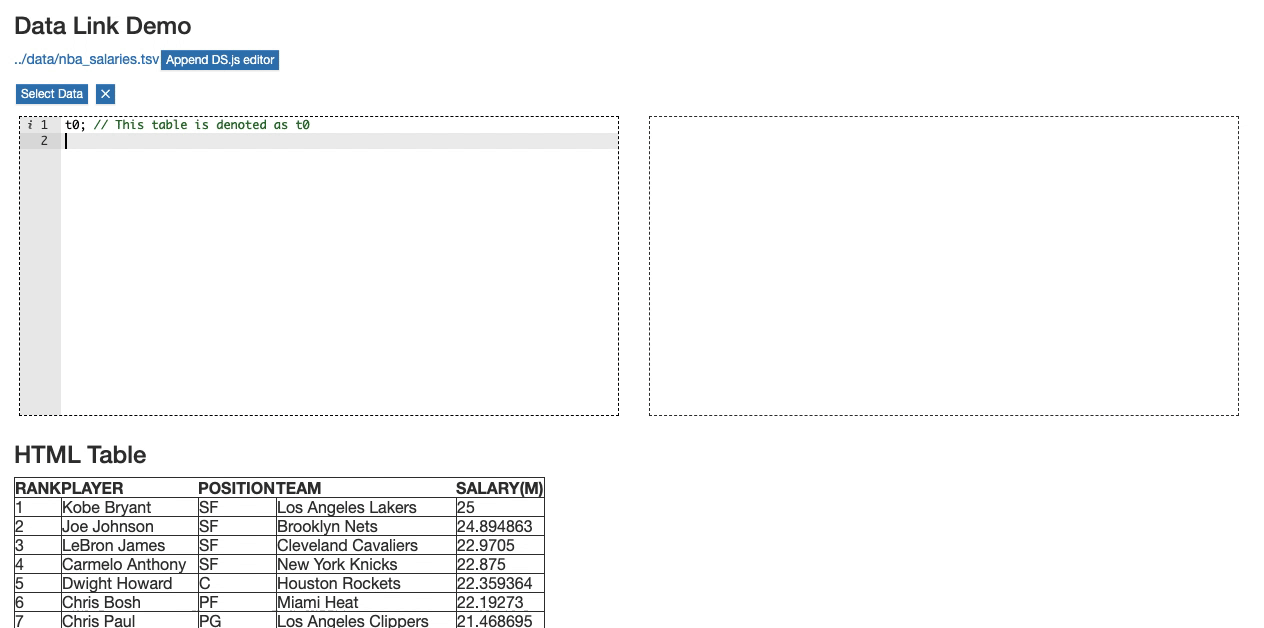
Detect Tabular Datasets
Simply click on the DS.js bookmarklet to put DS.js environments under csv/tsv links or HTML tables.
GIF Demo
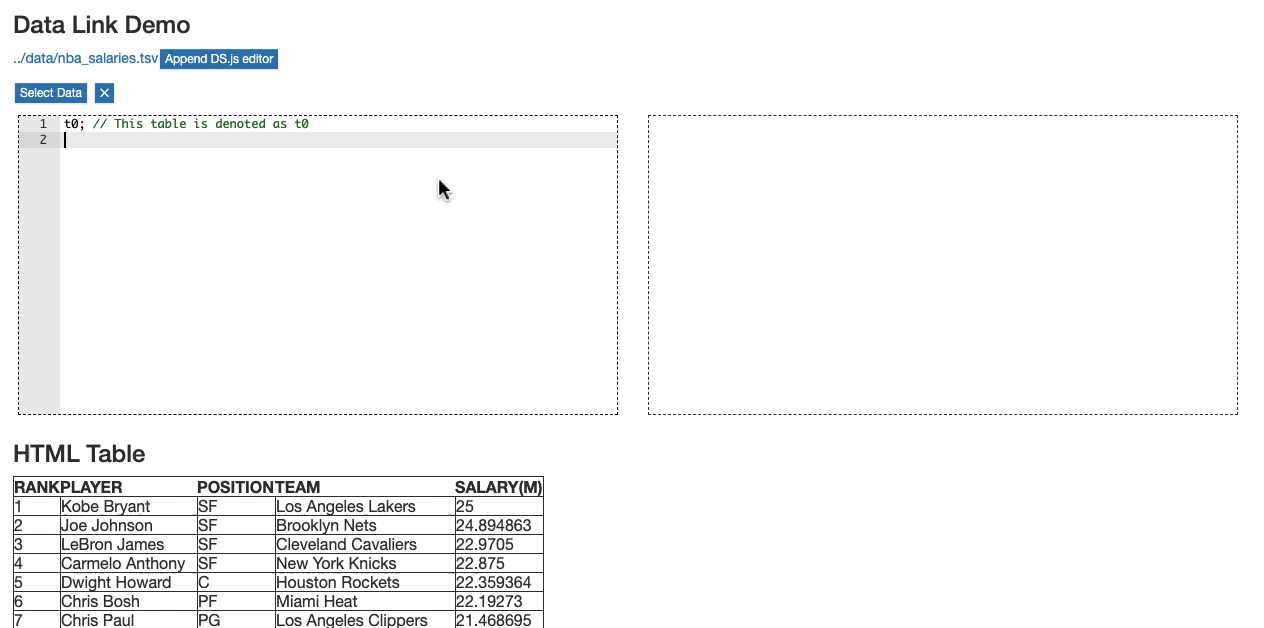
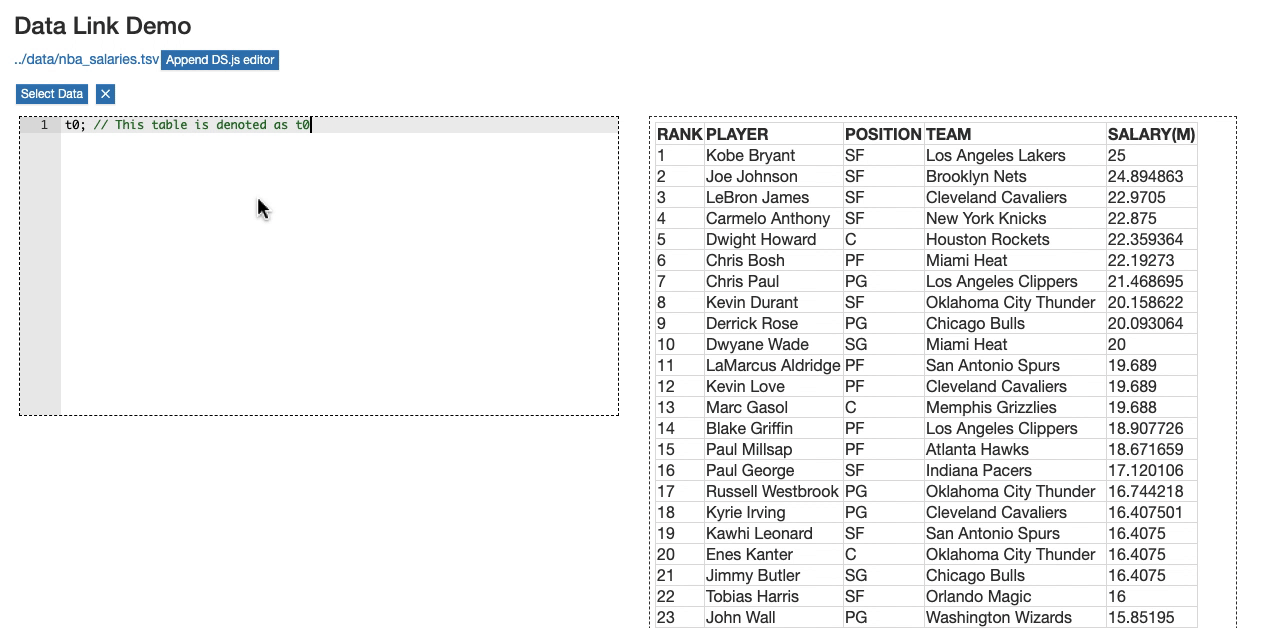
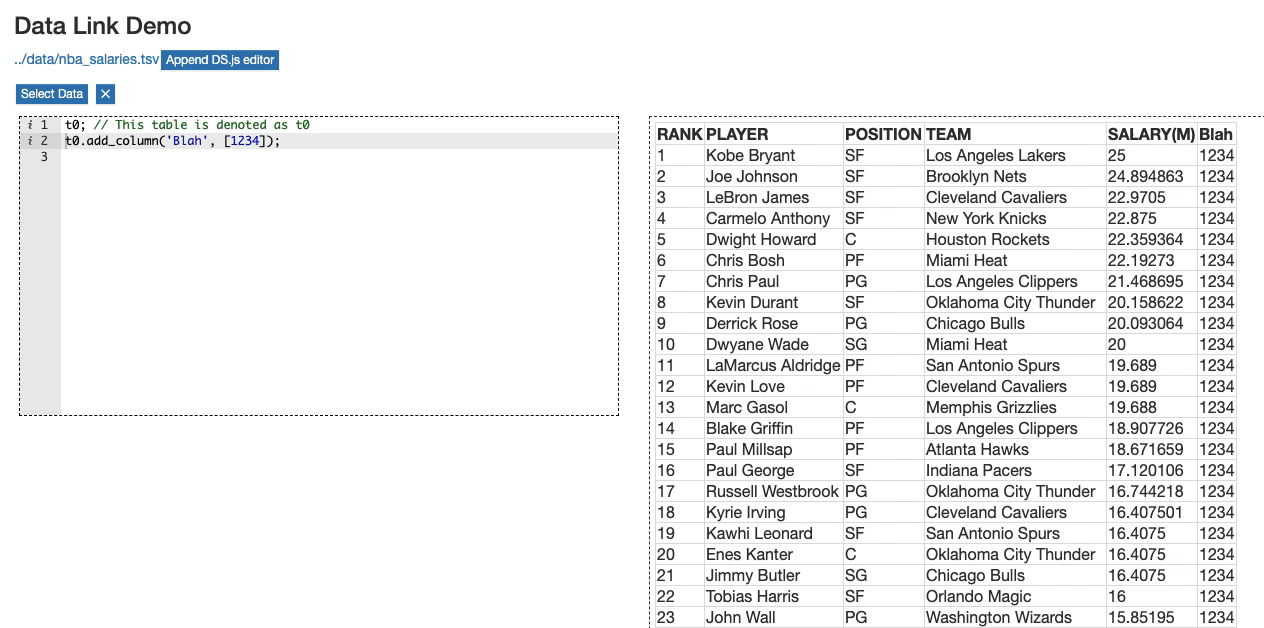
Program with table.js API
Manipulate the parsed datasets with dataframe style programming APIs.
GIF Demo
Visualize Data
Create visualizations with table.js, which wraps vega APIs.
GIF Demo
Preview from Code to Data or vice versa
Get hints about the usage of table.js APIs with previews.
Code to Data Preivew
Move the editor cursor to a table.js manipulation function and press ⌘ + B to preview its effect.
GIF Demo
Data to Code Preview
When the output pane is showing a table, click on any cell to get in-context suggestions on available table.js APIs.
GIF Demo
Share your code via URLs
Copy the URL of the webpage with capsulated DS.js code and send it to others to share your work.
GIF Demo
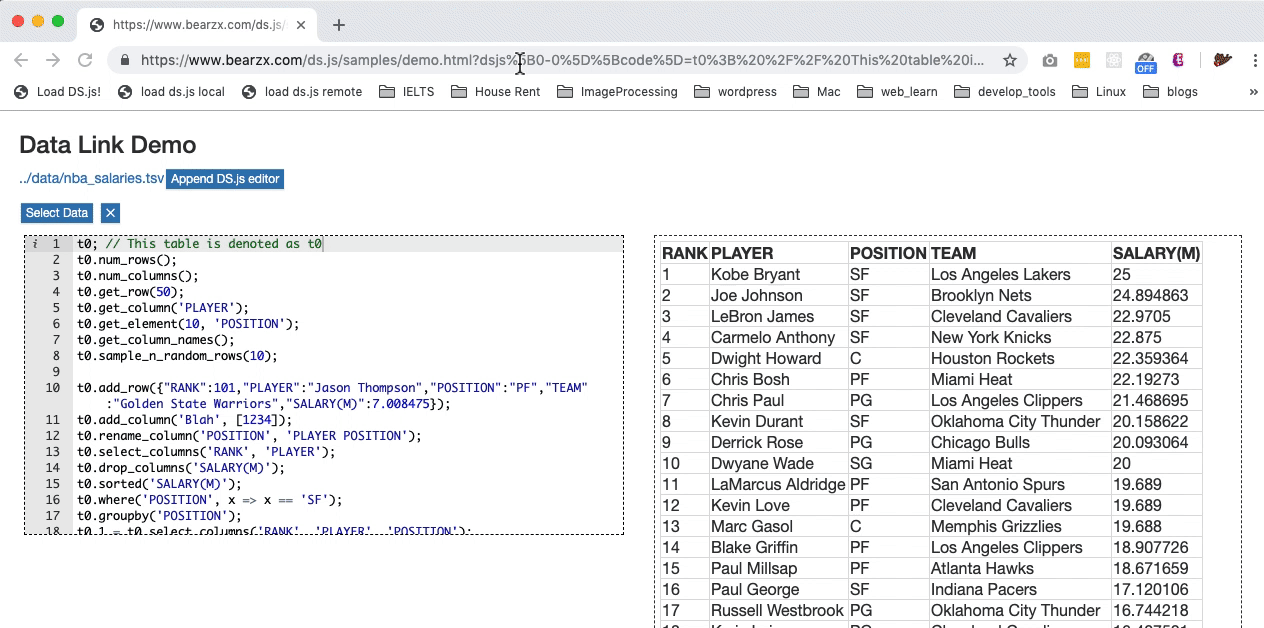
table.js APIs
table.js is compiled from src/table.ts TypeScript source file. Here we show some short descriptions on its public APIs.
| Function | is for … |
|---|---|
convert(cast: Function) |
convert all the elements with a cast function (e.g. parseInt) |
converted(cast: Function) |
functional version of convert |
auto_convert() |
heuristically convert table cell content into numbers (using numeral.js) |
read_table_csv_sync(url: string) |
load .csv file from a remote url in a synchronous manner |
read_table_tsv_sync(url: string) |
load .tsv file from a remote url in a synchronous manner |
set(column_or_label, f) |
mutate the content of a column with a mapping function f |
get_element(row, col) |
get the content of a cell |
num_rows() |
get the number of rows |
get_column_names() |
get all the column labels in an array |
num_columns() |
get the number of columns |
get_column(index_or_label) |
get the content of a column given its index or label |
get_columns() |
get the content of all the columns in an array (of arrays) |
get_row(index) |
get the content of a row in an object given its index |
get_rows() |
get the content all the rows in an array (of objects) |
add_rows(rows) |
add one or more rows to the end of the table |
add_column(label, values) |
add a new column |
add_columns(...label_and_vales) |
add one or more columns |
rename_column(label, new_label) |
change the name of a column |
copy_table() |
get a copy of the current table |
select_columns(...column_label_or_labels) |
get a sub-table of selected columns |
drop_columns(...column_label_or_labels) |
drop one or more columns |
where(column_or_label, value_or_predicate) |
filter rows based on the values of a given column by exactly matching a value or applying a predicate |
sort(column_or_label, descending = false) |
sort all the rows based on the values of a given column |
sorted(column_or_label, descending = false) |
functional version sort |
groupby(column_or_label, collect?) |
aggregate all the rows based on a column, count the occurrence by default |
groupsby(columns_or_labels, collect?) |
aggregate all the rows based on more than one columns, count the occurrence by default |
pivot(columns, rows, values, collect?) |
generate a pivot table |
join(column_label, other: Table, other_label?) |
join with another table based on two columns |
summary_statistics() |
generate a summary table (including min, max, median, sum) of all the columns |
percentile(p) |
get the first p% sorted rows |
sample_n_random_rows(k) |
randomly sample k rows |
split(k) |
split the current table into two: first k rows and the last n - k rows |
lineplot(xlabel, ylabel, xtype = 'quantitative') |
generate a line plot of two columns |
barplot(xlabel, ylabel, xtype = 'nominal', ytype = 'quantitative' ) |
generate a bar plot of two columns |
scatterplot(xlabel, ylabel, xtype = 'quantitative') |
generate a scatter plot of two columns |
histogram(column, nbins = 10) |
generate a histogram of a column |
boxplot(xlabel, ylabel) |
generate a boxplot of two columns |
Example Pages
A made-up webpage with example code to show the table.js APIs can be found here.
Build Instructions
We are able to build the system with the following environment: macOS 10.14.5, node 10, webpack 4.
To build the system, in the project root, simply type webpack (after npm install). If everything goes correctly you should be able to find the compiled and bundled js code in the dist/ directory.
License
MIT